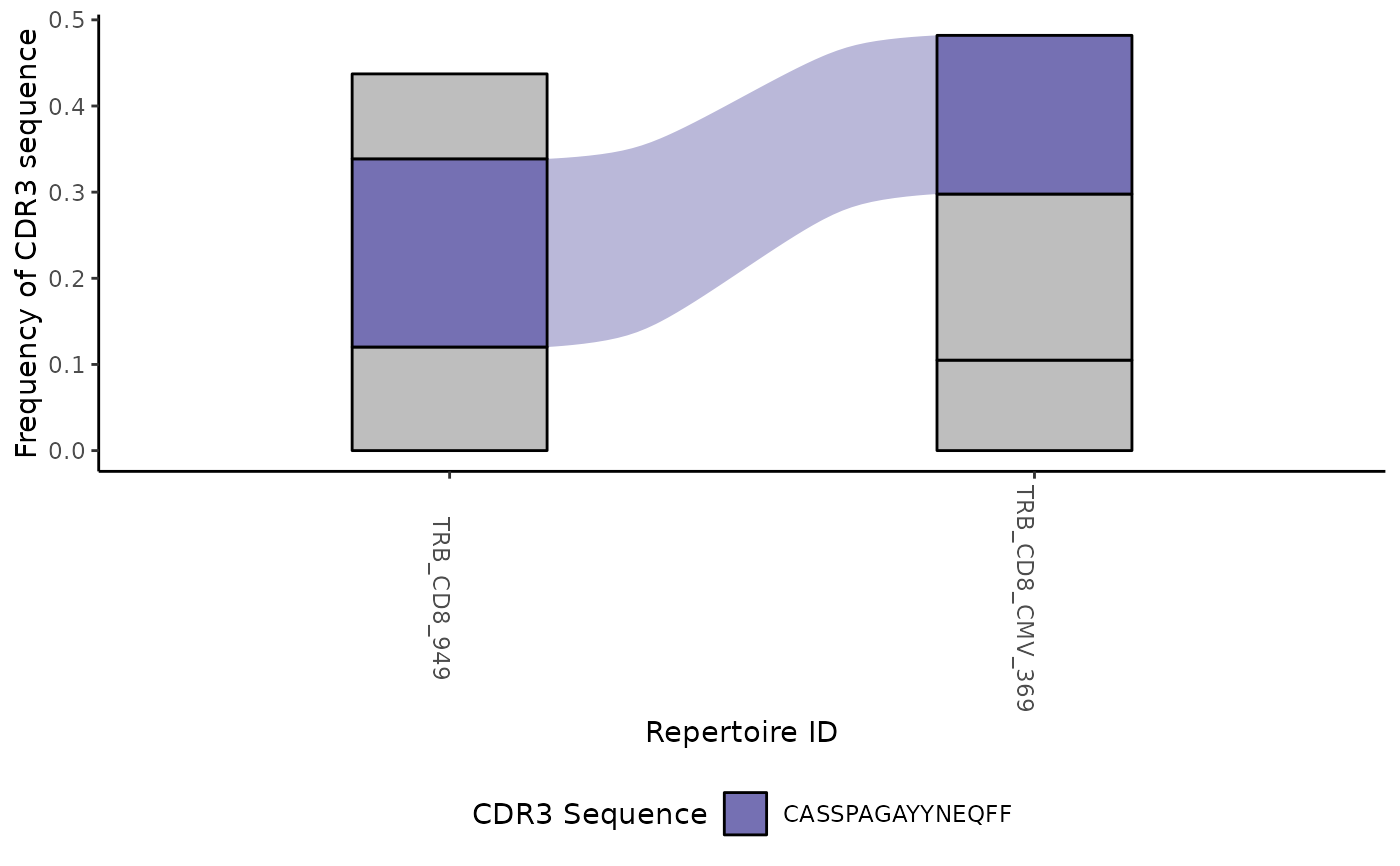
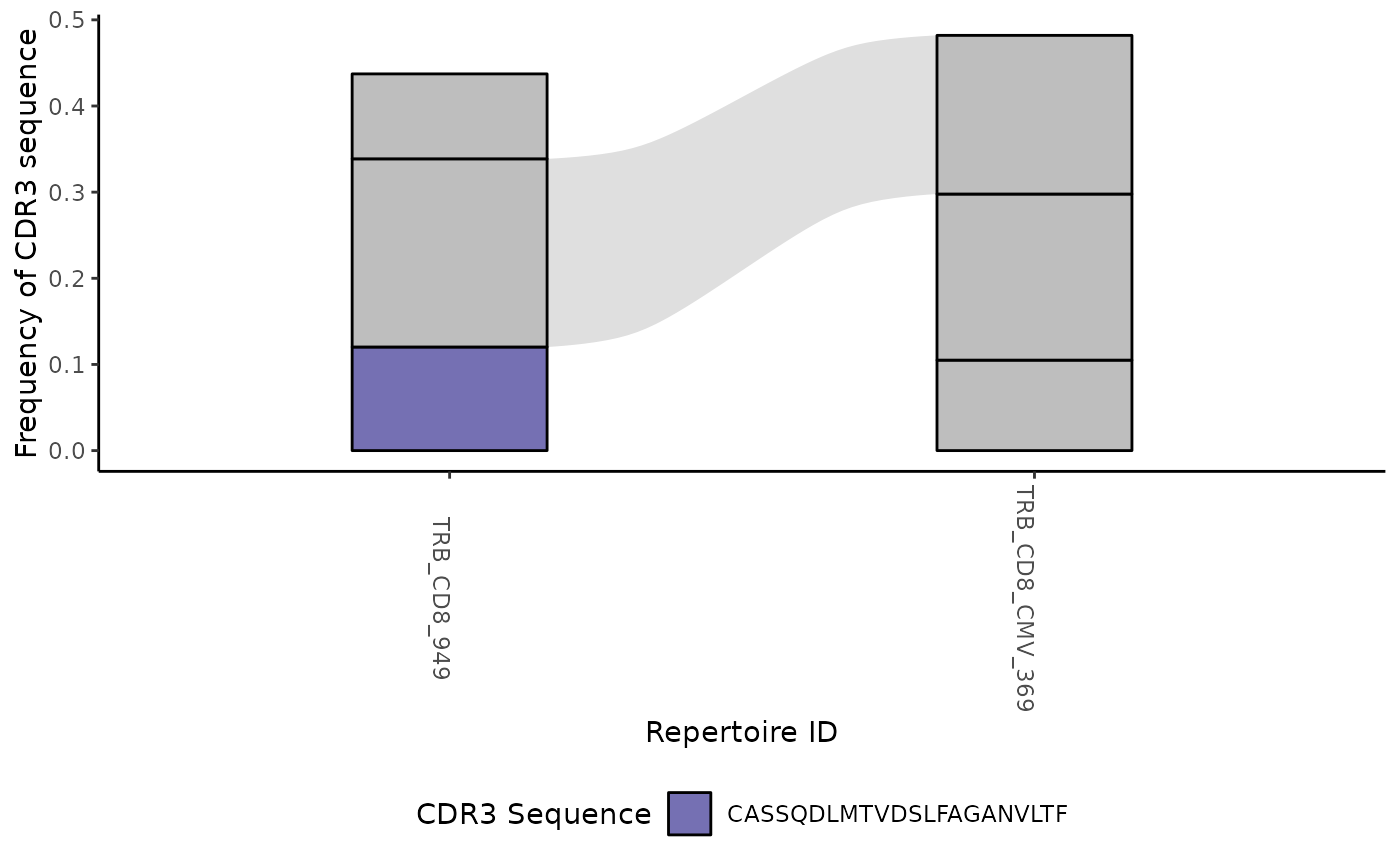
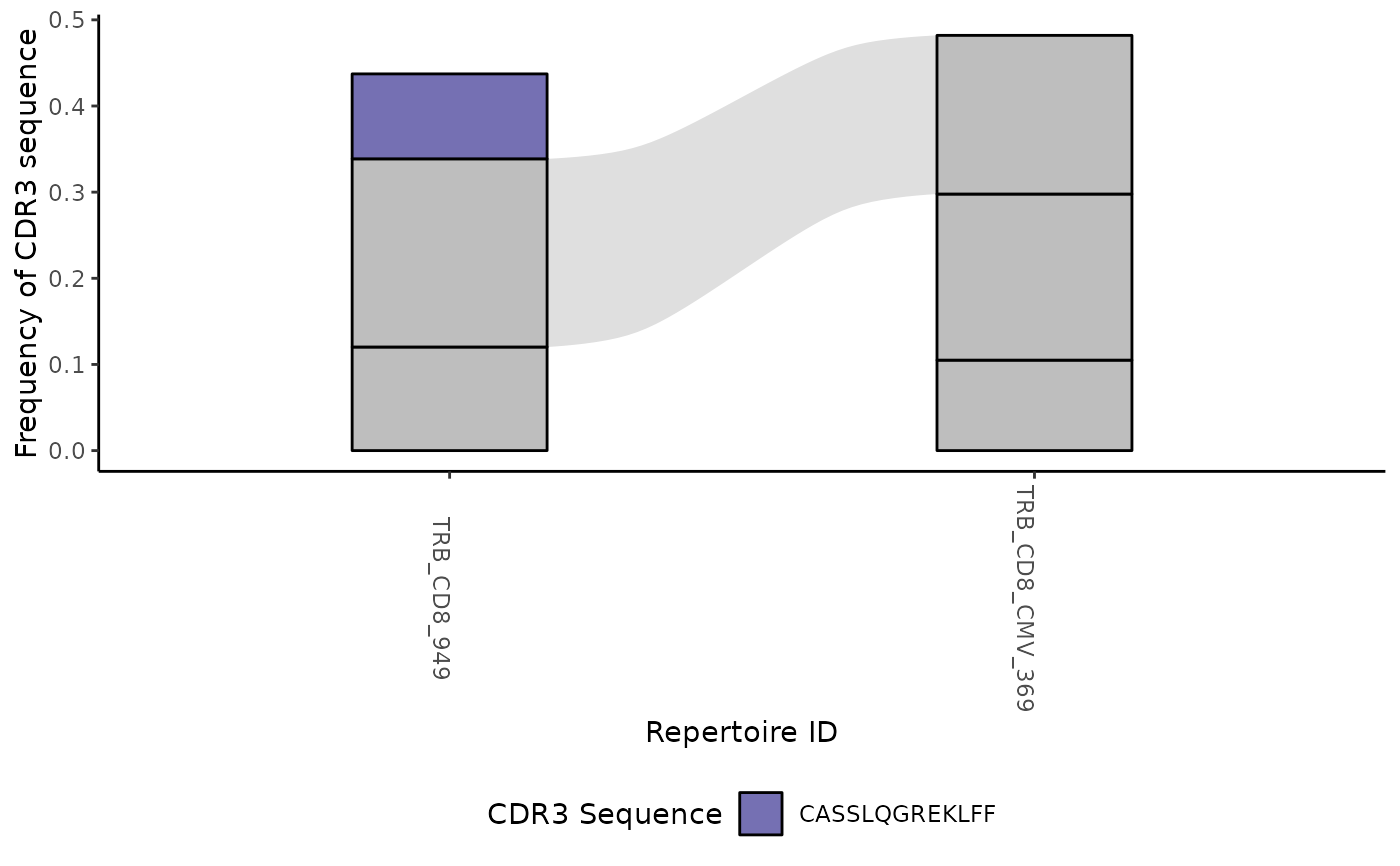
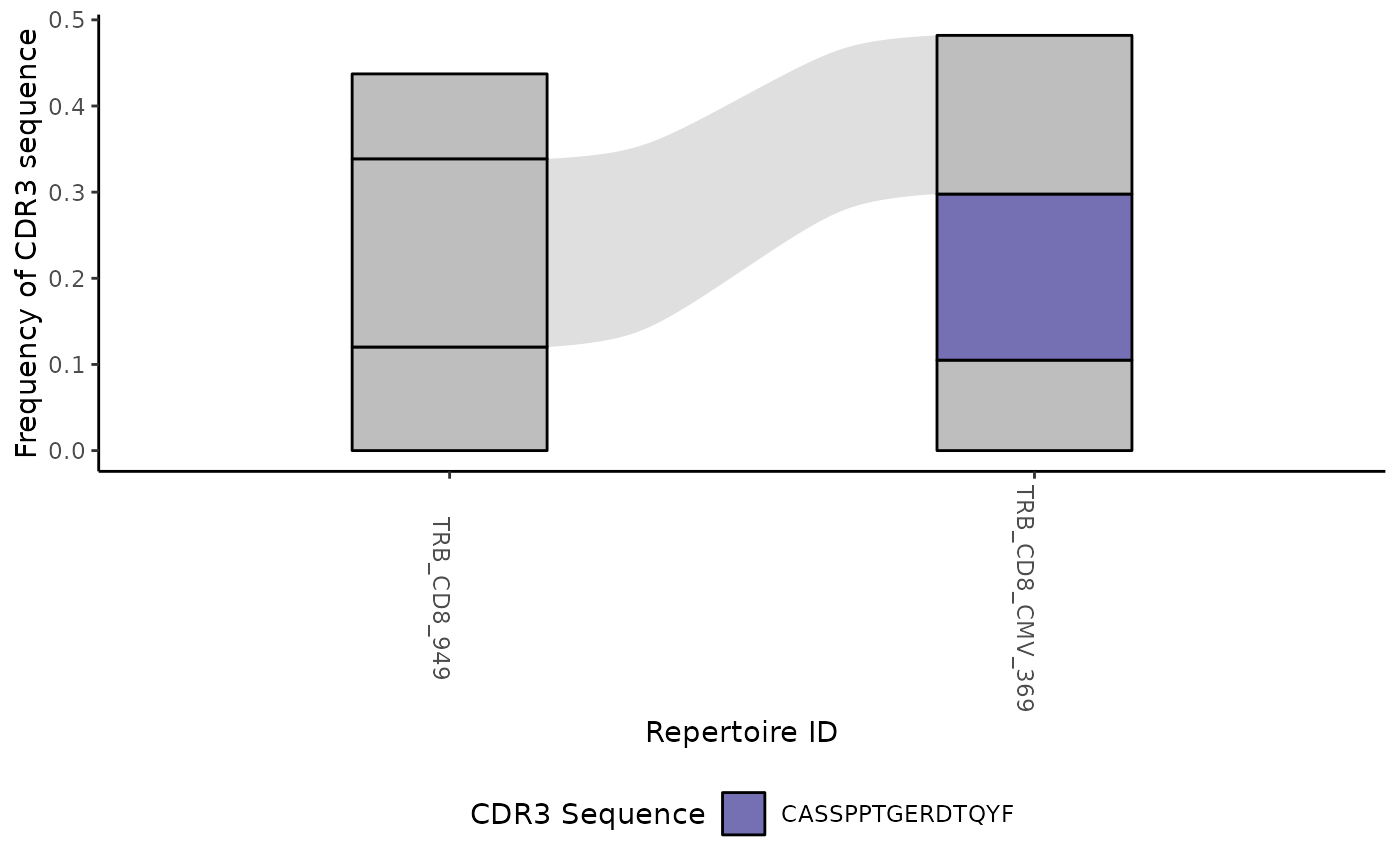
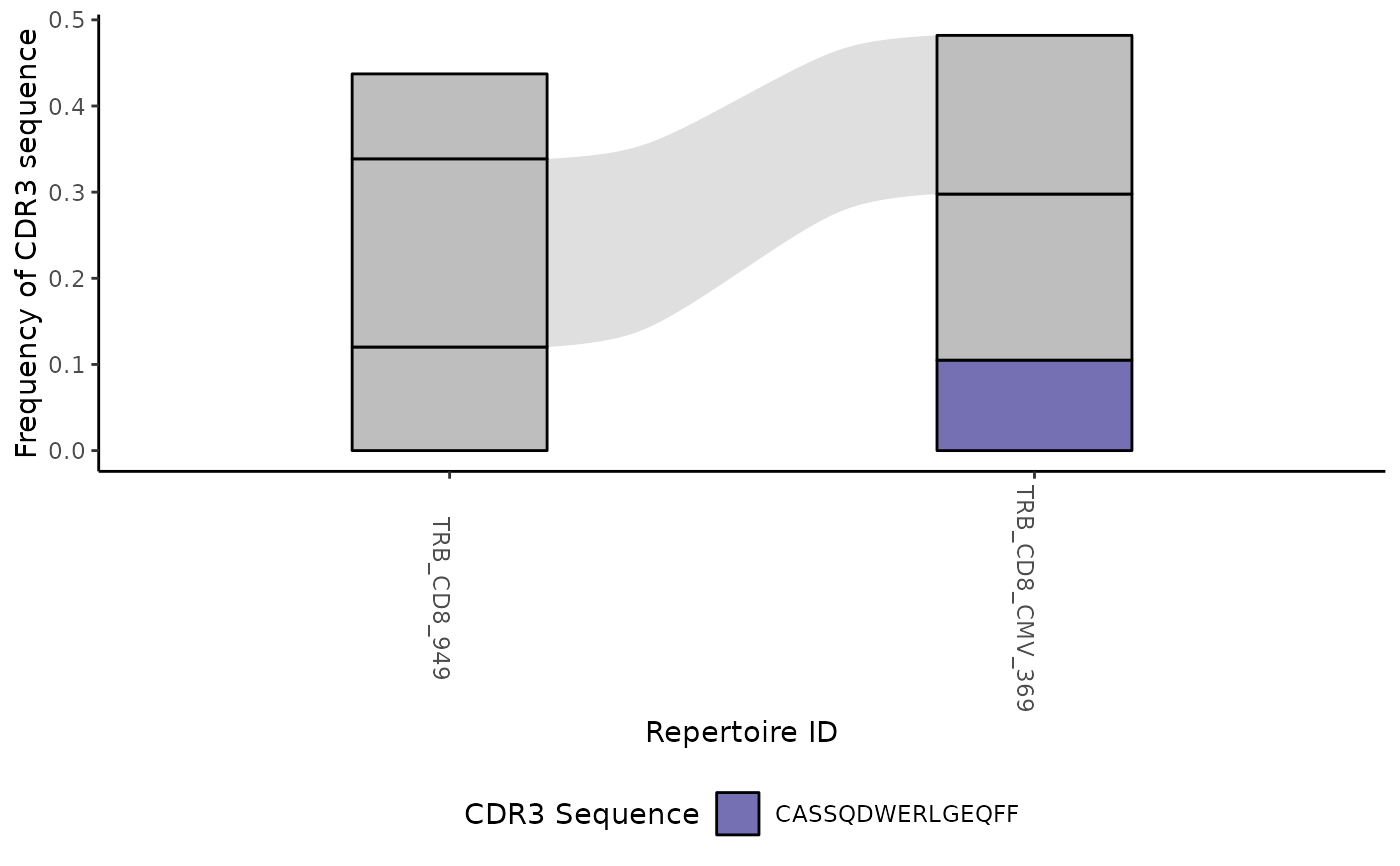
Create alluvial plots highlighting each sequence in amino acid list
Arguments
- clone_table
tibble of productive amino acid sequences to highlight generated by LymphoSeq function cloneTrack
- aseq
CDR3 amino acid sequence to highlight
Examples
file_path <- system.file("extdata", "TCRB_sequencing", package = "LymphoSeq2")
study_table <- LymphoSeq2::readImmunoSeq(path = file_path, threads = 1)
study_table <- LymphoSeq2::topSeqs(study_table, top = 100)
amino_table <- LymphoSeq2::productiveSeq(study_table, aggregate = "junction_aa")
top_seq <- LymphoSeq2::topSeqs(amino_table, top = 3)
clone_table <- LymphoSeq2::cloneTrack(
study_table = top_seq,
sample_list = c("TRB_CD8_949", "TRB_CD8_CMV_369")
)
LymphoSeq2::plotTrackSingular(clone_table)
#> [[1]]
 #>
#> [[2]]
#>
#> [[2]]
 #>
#> [[3]]
#>
#> [[3]]
 #>
#> [[4]]
#>
#> [[4]]
 #>
#> [[5]]
#>
#> [[5]]
 #>
#>