Plot rarefaction and extrapolation curves for samples
Source:R/rarefactionCurve.R
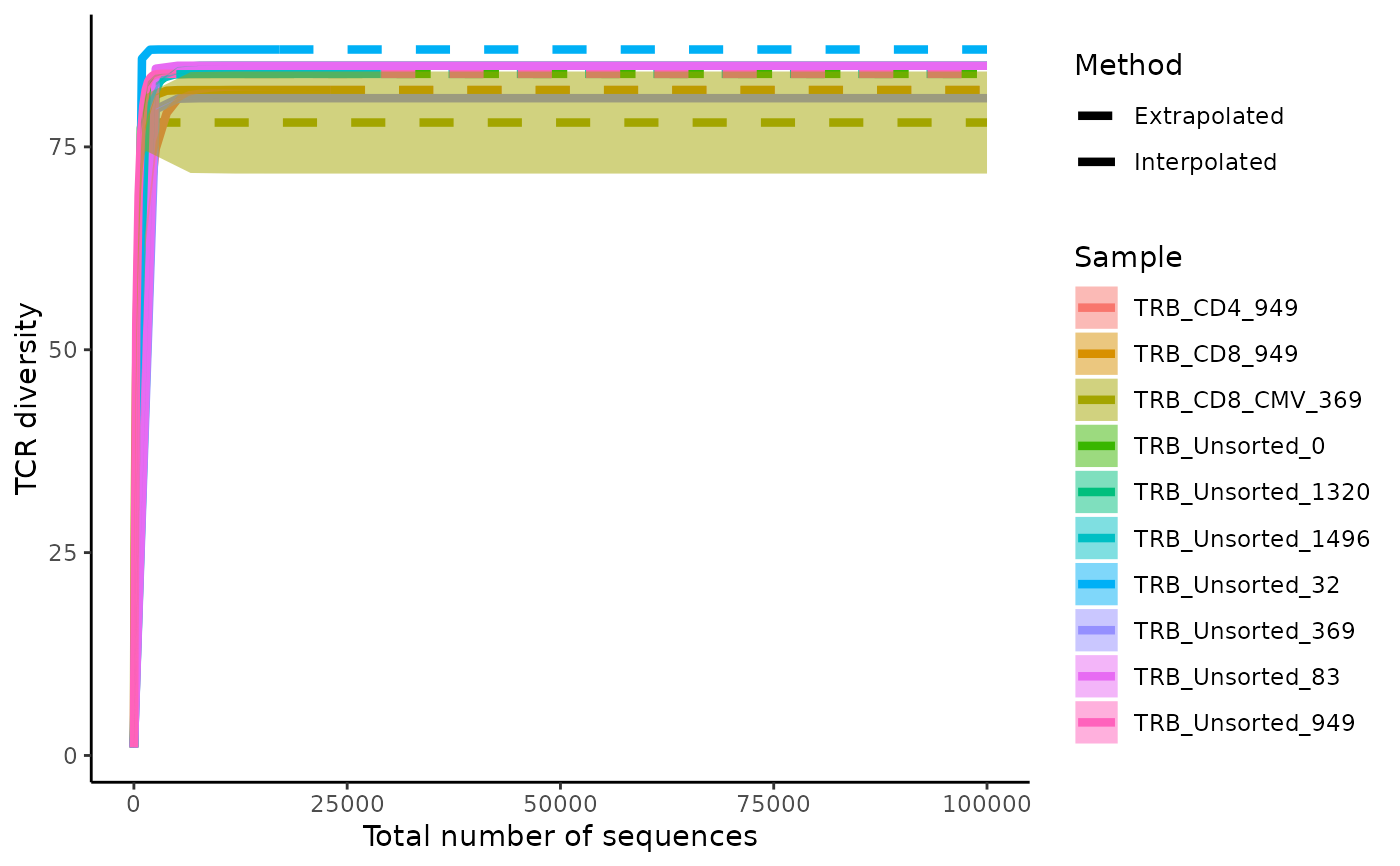
plotRarefactionCurve.RdGiven a study table, for each sample plot rarefaction curves to estimate repertoire diversity. The method used to generate the rarefaction curve is derived from Chao et al., (2014) using the iNEXT library
Arguments
- study_table
A tibble consisting antigen receptor sequencing data imported by the LymphoSeq2 function
readImmunoSeq(). "junction_aa", "duplicate_count", and "duplicate_frequency" are required columns.
Examples
file_path <- system.file("extdata", "TCRB_sequencing", package = "LymphoSeq2")
study_table <- LymphoSeq2::readImmunoSeq(path = file_path, threads = 1)
study_table <- LymphoSeq2::topSeqs(study_table, top = 100)
LymphoSeq2::plotRarefactionCurve(study_table)