Creates a heat map from a Bhattacharyya, Similarity, Sorensen, or PSI matrix.
Arguments
- matrix
A Bhattacharyya, Similarity, Sorensen, or PSI matrix produced by the LymphoSeq2
scoringMatrix()function.
Details
The plot is made using the package ggplot2 and can be reformatted using ggplot2 functions. See examples below.
See also
An excellent resource for examples on how to reformat a ggplot can
be found in the R Graphics Cookbook online (http://www.cookbook-r.com/Graphs/).
The functions to create the similarity matrices can be found
here: scoringMatrix()
Examples
file_path <- system.file("extdata", "TCRB_sequencing", package = "LymphoSeq2")
study_table <- LymphoSeq2::readImmunoSeq(path = file_path, threads = 1)
study_table <- LymphoSeq2::topSeqs(study_table, top = 100)
amino_table <- LymphoSeq2::productiveSeq(study_table, aggregate = "junction_aa")
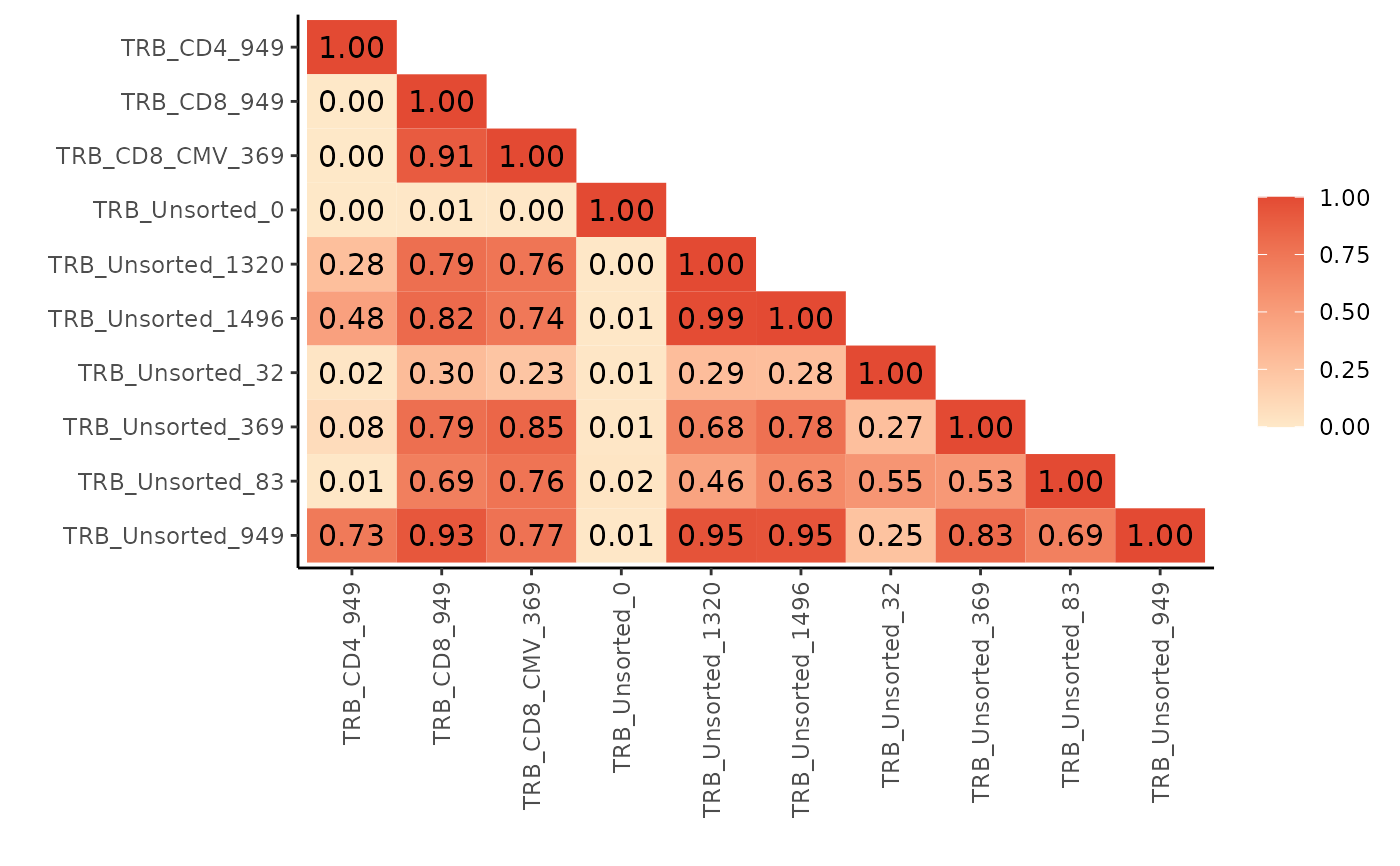
# Plot similarity using Similarity score
similarity_matrix <- LymphoSeq2::scoringMatrix(
productive_table = amino_table,
mode = "Similarity"
)
LymphoSeq2::pairwisePlot(matrix = similarity_matrix)
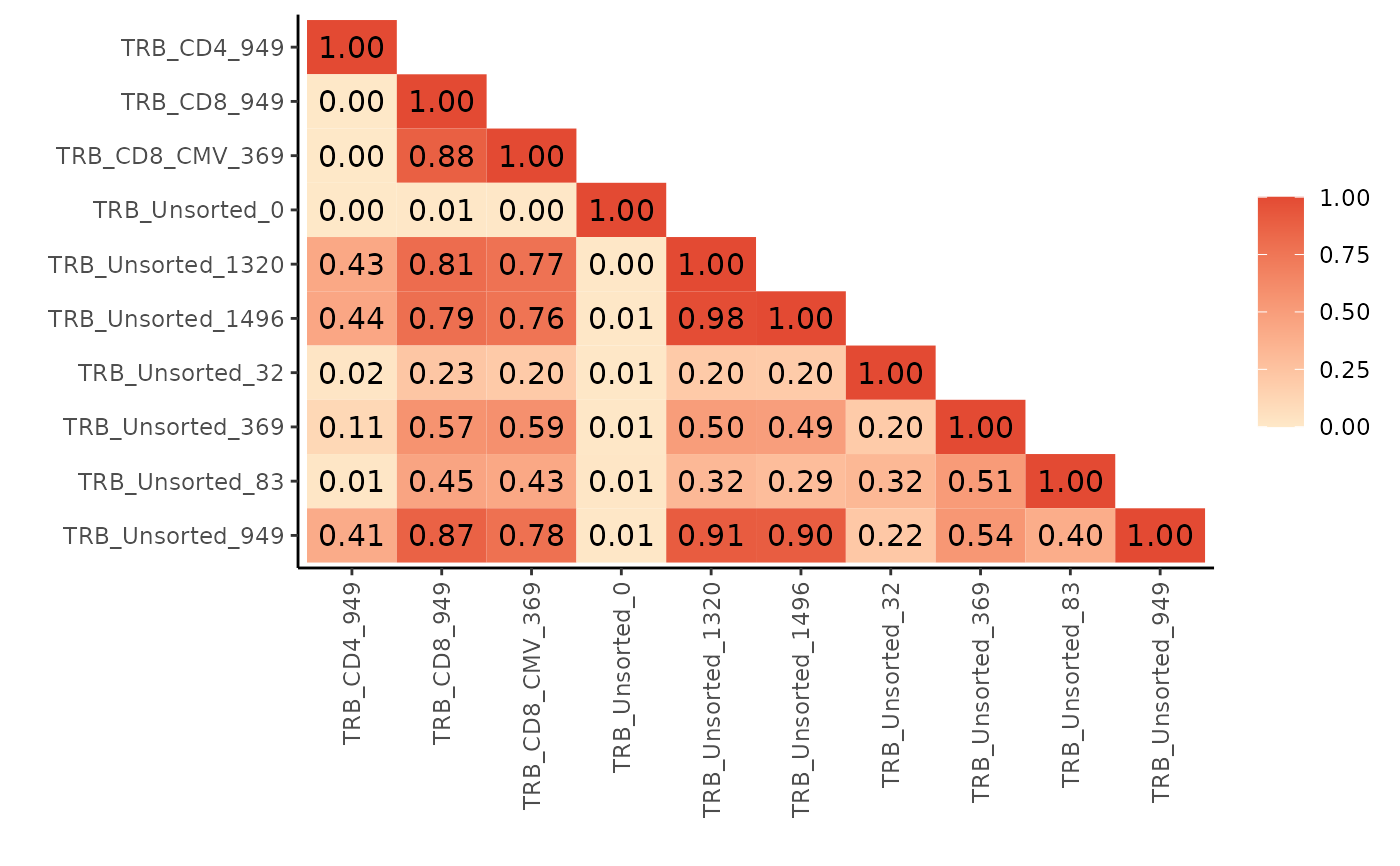
 # Plot similarity using Bhattacharyya score
bhattacharyya_matrix <- LymphoSeq2::scoringMatrix(
productive_table = amino_table,
mode = "Bhattacharyya"
)
LymphoSeq2::pairwisePlot(matrix = bhattacharyya_matrix)
# Plot similarity using Bhattacharyya score
bhattacharyya_matrix <- LymphoSeq2::scoringMatrix(
productive_table = amino_table,
mode = "Bhattacharyya"
)
LymphoSeq2::pairwisePlot(matrix = bhattacharyya_matrix)
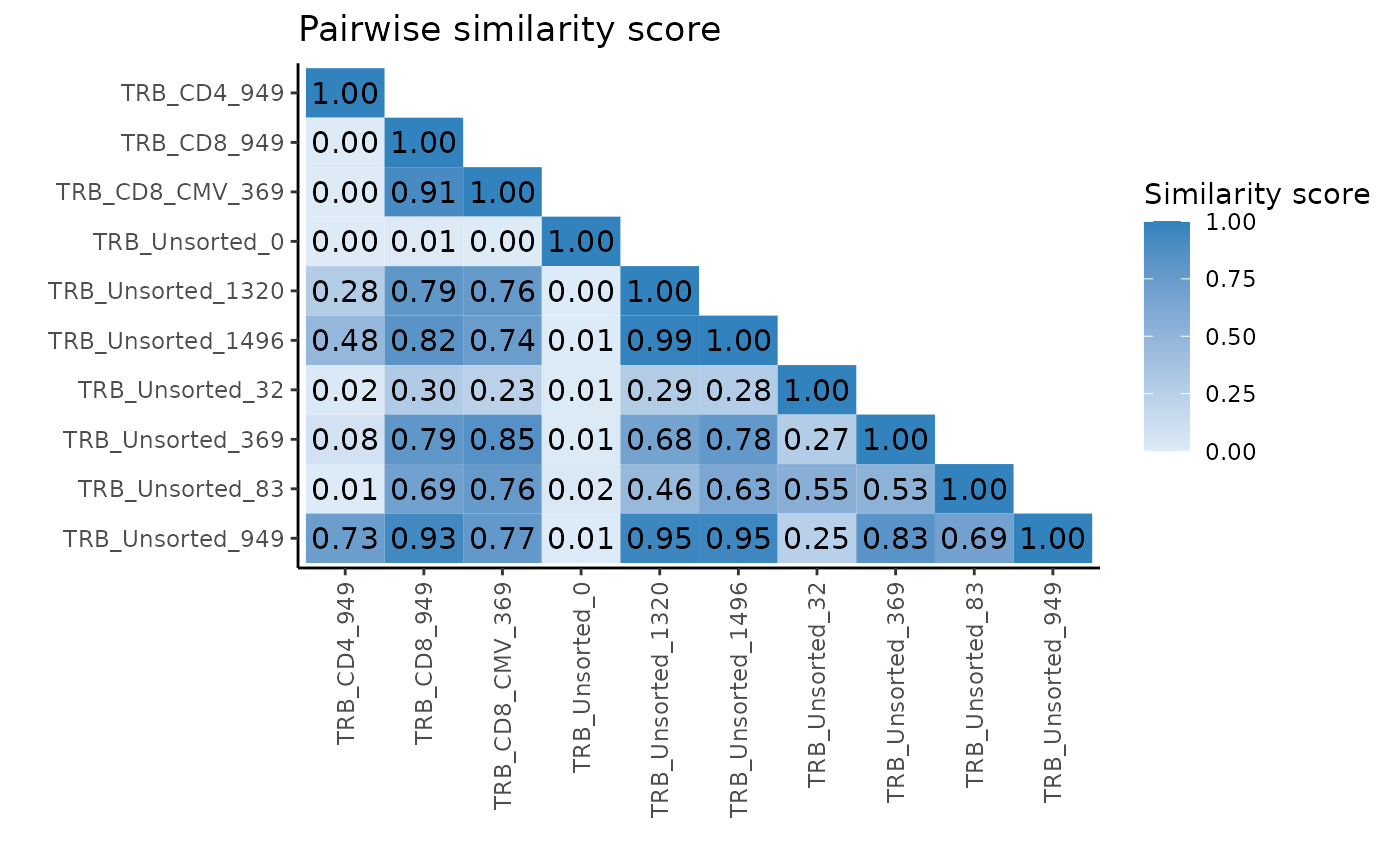
 # Change plot color, title legend, and add title
LymphoSeq2::pairwisePlot(matrix = similarity_matrix) +
ggplot2::scale_fill_gradient(low = "#deebf7", high = "#3182bd") +
ggplot2::labs(fill = "Similarity score") +
ggplot2::ggtitle("Pairwise similarity score")
#> Scale for fill is already present.
#> Adding another scale for fill, which will replace the existing scale.
# Change plot color, title legend, and add title
LymphoSeq2::pairwisePlot(matrix = similarity_matrix) +
ggplot2::scale_fill_gradient(low = "#deebf7", high = "#3182bd") +
ggplot2::labs(fill = "Similarity score") +
ggplot2::ggtitle("Pairwise similarity score")
#> Scale for fill is already present.
#> Adding another scale for fill, which will replace the existing scale.