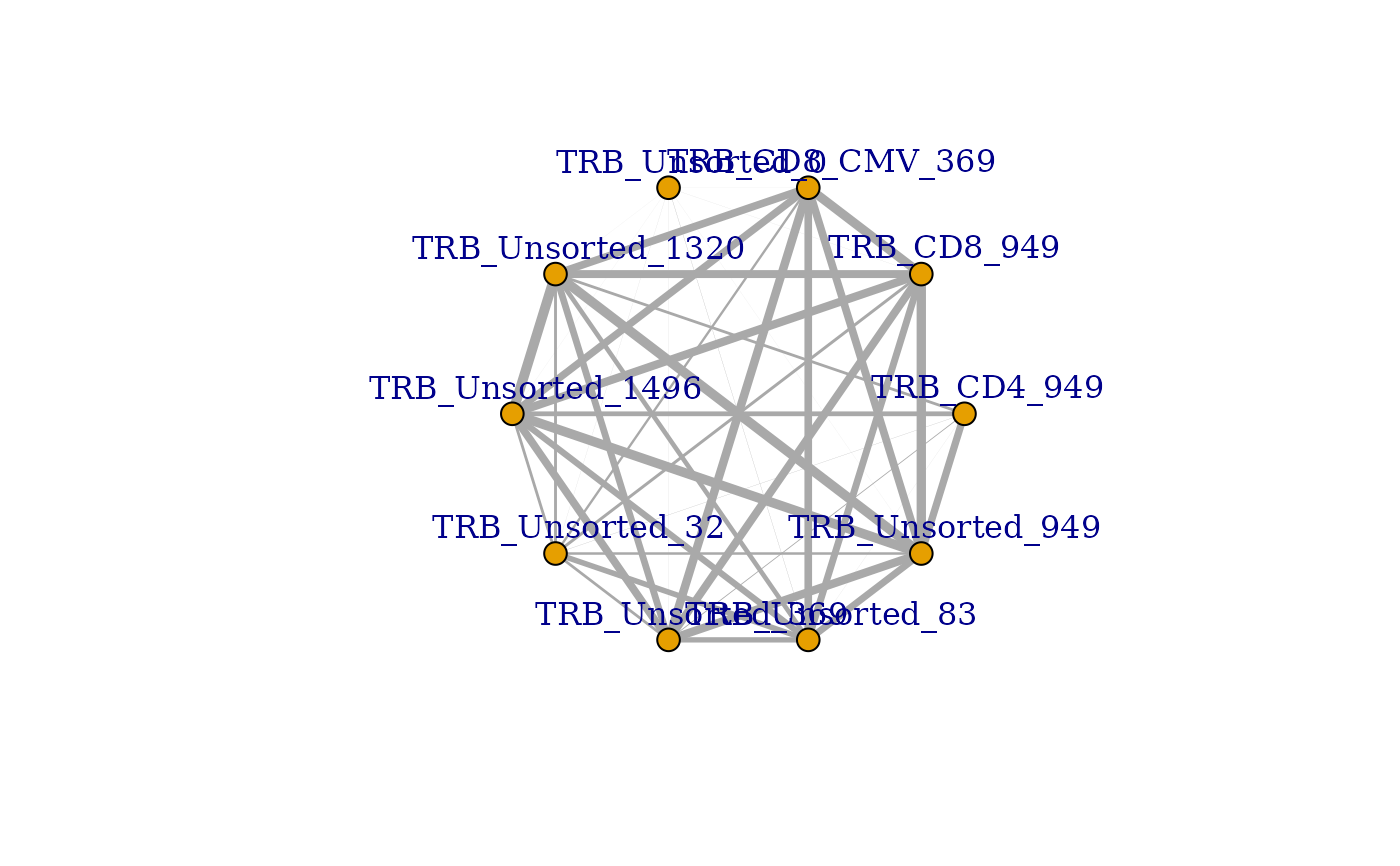
Creates a network graph from a Bhattacharyya, Similarity, Sorensen, or PSI matrix.
Arguments
- matrix
A Bhattacharyya, Similarity, Sorensen, or PSI matrix produced by the LymphoSeq2
scoringMatrix()function.
Value
A network graph visualizing pairwise comparisons. The thicker the line connecting two nodes, the greater the similarity.
Examples
file_path <- system.file("extdata", "TCRB_sequencing",
  package = "LymphoSeq2")
study_table <- LymphoSeq2::readImmunoSeq(path = file_path, threads = 1)
study_table <- LymphoSeq2::topSeqs(study_table, top = 100)
amino_table <- LymphoSeq2::productiveSeq(study_table = study_table,
  aggregate = "junction_aa")
matrix <- LymphoSeq2::scoringMatrix(amino_table, mode = "Similarity")
network_graph <- LymphoSeq2::pairwiseNetwork(matrix)
