Creates a scatter plot of just the sequences in common between two samples.
Arguments
- sample1
A name of a repertoire_id in a list of data frames generated by the LymphoSeq2 function
productiveSeq().- sample2
A name of a repertoire_id in a list of data frames generated by the LymphoSeq function
productiveSeq().- amino_table
A tibble of productive amino acid sequences produced by the function
productiveSeq()containing the samples to be compared.- show
A character vector specifying whether only the common sequences should be shown or all sequences. Available options are "common" or "all".
Details
The plot is made using the package ggplot2 and can be reformatted using ggplot2 functions. See examples below.
See also
An excellent resource for examples on how to reformat a ggplot can be found in the R Graphics Cookbook online (http://www.cookbook-r.com/Graphs/).
productiveSeq(), commonSeqs(),
commonSeqsVenn(), commonSeqsBar()
Examples
file_path <- system.file("extdata", "TCRB_sequencing", package = "LymphoSeq2")
study_table <- readImmunoSeq(path = file_path, threads = 1)
study_table <- LymphoSeq2::topSeqs(study_table, top = 100)
amino_table <- productiveSeq(study_table = study_table, aggregate = "junction_aa")
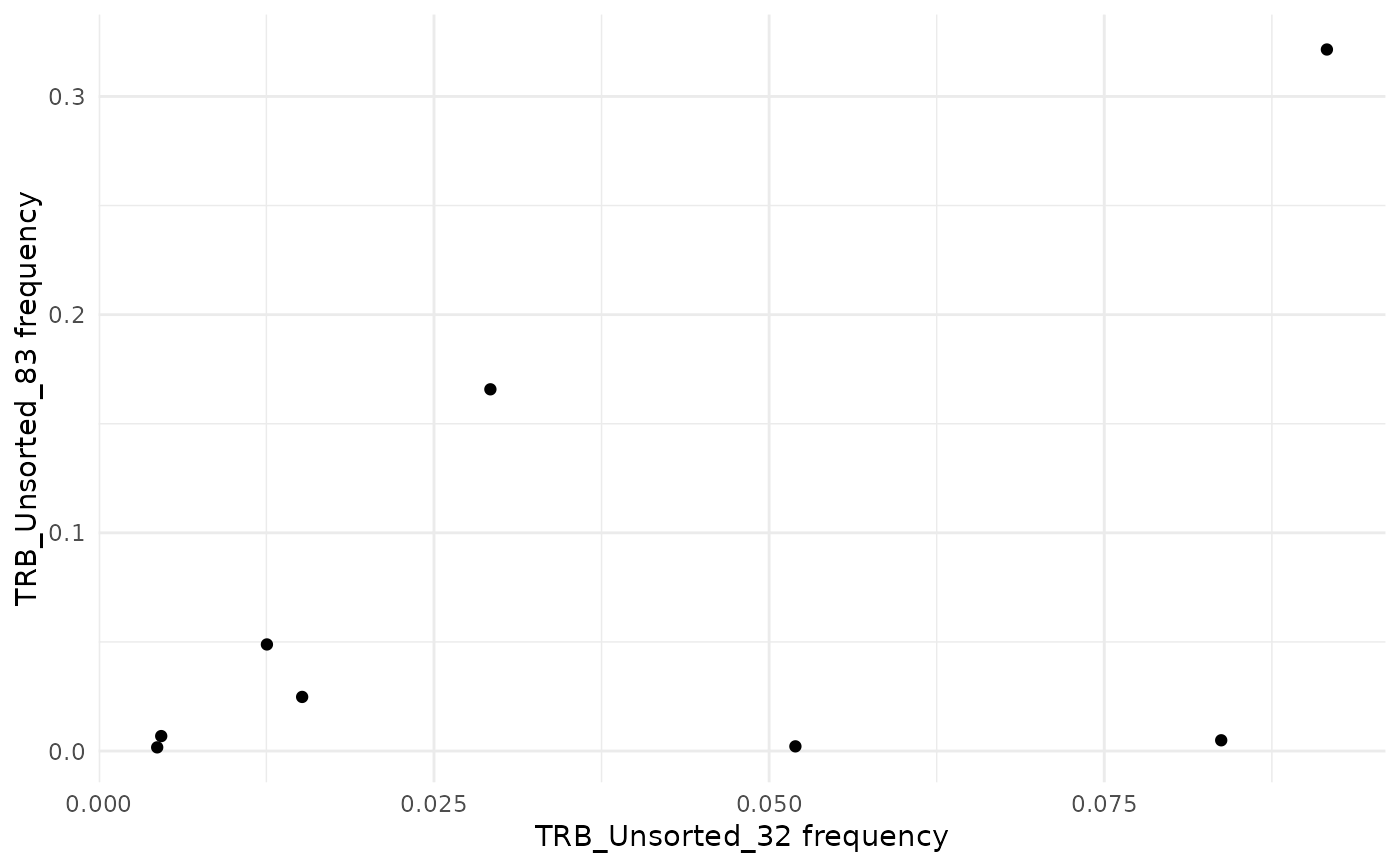
commonSeqsPlot("TRB_Unsorted_32", "TRB_Unsorted_83",
amino_table = amino_table
)
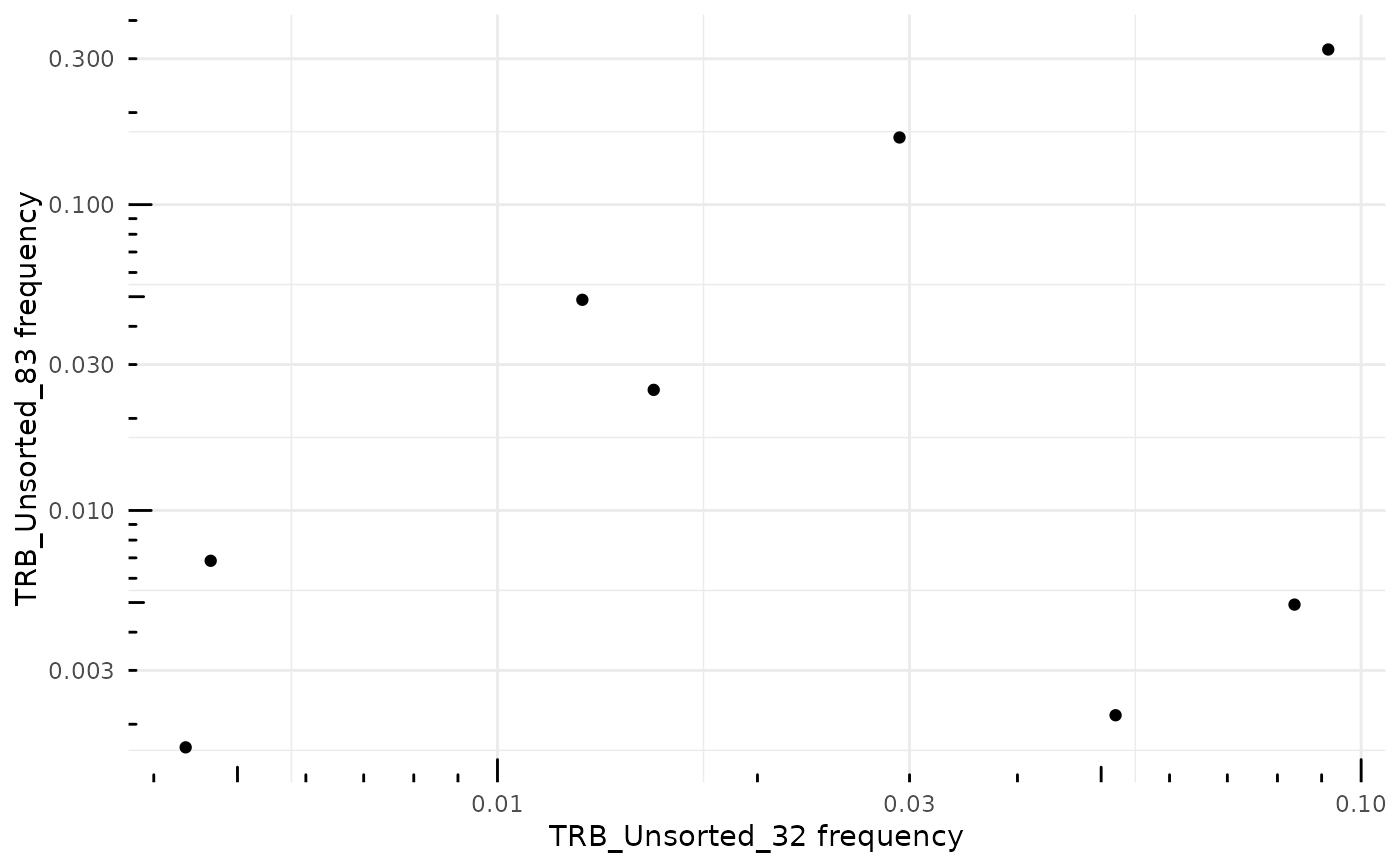
 # Change the X and Y axis to log-10 scale
commonSeqsPlot("TRB_Unsorted_32", "TRB_Unsorted_83",
amino_table = amino_table
) +
ggplot2::scale_x_log10() +
ggplot2::scale_y_log10() +
ggplot2::annotation_logticks(sides = "bl")
# Change the X and Y axis to log-10 scale
commonSeqsPlot("TRB_Unsorted_32", "TRB_Unsorted_83",
amino_table = amino_table
) +
ggplot2::scale_x_log10() +
ggplot2::scale_y_log10() +
ggplot2::annotation_logticks(sides = "bl")